
 Search Here
MISC
Parts List
Robot Forum
Chat
Member Pages
Axon MCU
Robot Books
Shop
Contact
SKILLS
How To Build
A Robot
Tutorial
Calculators
Mechanics
Programming
Miscellaneous
Robots
Space
HARDWARE
Actuators
Batteries
Electronics
Materials
Microcontrollers
Sensors
SCIENCE
Robot Journals
Robot Theory
Conferences
- balloon release
- rising through the jet stream
- balloon pop
- falling through the jet stream
- crash landing (not recorded due to software error)
=== IMU Tutorial ===

Introduction to IMU's for Space Balloons
When designing the mechanical aspects of a balloon system, you need to know what forces it will experience.
To quantitatively determine those forces, a 6 DoF IMU (Inertial Measurement Unit) was placed on board.
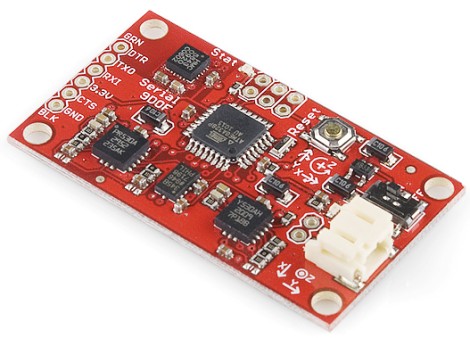
To do this experiment, I data logged IMU data from the LY530AL (single-axis gyro), the LPR530AL (dual-axis gyro), and the ADXL345 (triple-axis accelerometer). They were mounted on the somewhat now outdated Razor 9 Degrees of Freedom IMU, as shown below.
Recording Method
As the IMU data was being logged by a microcontroller coordinating a dozen other devices, a high speed logging system
was not possible. Given this constraint, it was possible that extreme but short lived forces could be missed.
To compromise, the system was programmed to read forces over a period of time, but then only record the absolute maximum
during that period of time. For flight SB5, the period was once every 10 seconds.
Ideally, a dedicated recorder would be best. Another member of our team had a dedicated 3 DoF accelerometer, but his data has over 625k data points (per axis). Excel only plots up to 32k data points, so I don't have the software to let me look at it properly. He also only gave the data as 8 bit ADC values and didn't convert it to a G-force. You'll have to contact him if you want more info . . .
Results
The first below chart (click to enlarge) consists of data from the 3 DoF accelerometer. It appears that the most extreme
force is around 2G - much lower than I expected. The most extreme forces were detected during:
note: Looking at the data, there appears to be clipping at 2G - bringing into question the reliability of the data. I tested it and it correctly measures 1G, and the datasheet says 'a minimum full-scale range of �3 g', so maybe just a coincidence . . . I'll have a deeper look into the software and update this section when I figure it out. Perhaps it was configured to have a 2G max sensitivity and I didn't realize it?

note: The plotted altitude was determined by using a pressure sensor as my GPS failed for most of this flight. The pressure sensor error is fairly large at higher altitudes, as shown in the pressure sensor tutorial. The true top altitude was approximately ~118.5k feet during this particular flight.
I didn't really expect the force of the balloon explosion to show up on the accelerometer. This is what the exploding balloon fragments looks like, as accidentally filmed by our camera:

You can also see it burst at the end of our video.
But the most informative video was taken by another team (not us) which set up a camera to intentionally film the burst:
This next chart (click to enlarge) consists of data from the 3 DoF gyroscope. The data shows that the package did not experience any extreme gyroscopic forces. This was of course obvious by looking at the video from the onboard camera, but still, it's nice to have good quantitative data. Looking at the chart, the most extreme gyroscopic forces were experienced during handling before launch, and again after the balloon popped and the package was falling in a near vacuum. The weakest gyro forces were while the package was at its highest altitudes - basically the peaceful calm of space.

By basic laws of physics the further away an object is from Earth, the lesser the pull of gravity. At 100k feet altitude, gravity should be about 1% less. To measure this, you'd need to look at G-force. As the balloon was never motionless, there was no point at which a G-force could be determined accurately enough to see a 1% drop in gravity.
To calculate G-force using the IMU data, I used this equation:
- sqrt(gX^2 + gY^2 + gZ^2)
This is what the G-force looked like throughout the mission:
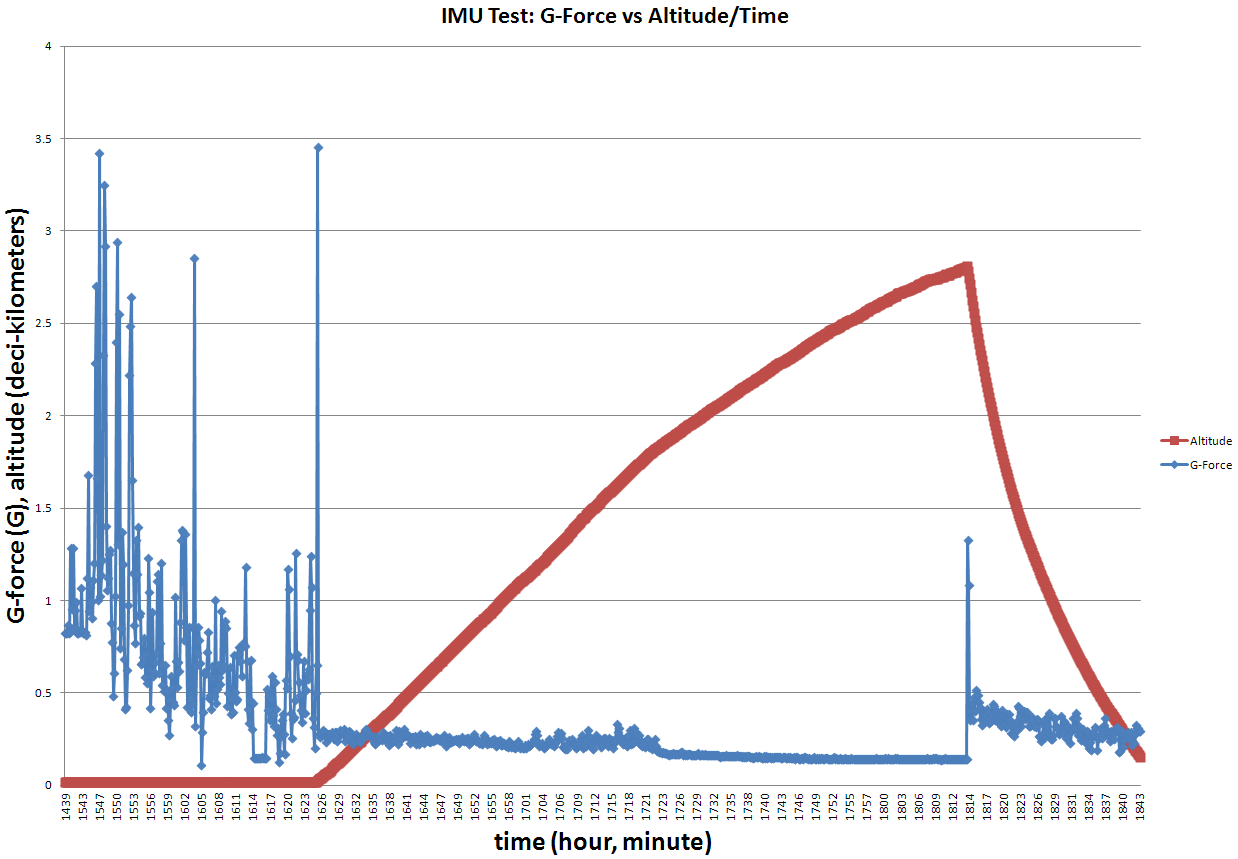
Interestingly, the highest measured G-forces was during the user handling of the package *before* the launch! And of course one big G-force spike right at lift-off as the balloon yanked the package from my hands. Unfortunately the system had an error just before landing so I was unable to get a landing measurement.
Society of Robots copyright 2005-2014